


Are Your Stats Betraying You? Simpson’s Paradox Explained
Why Summaries Can Mislead and How Analysts Can Stay One Step Ahead

Simpson’s Paradox can be confusing, even for experienced data analysts. It occurs when a trend that appears within different groups of data reverses or disappears when those groups are combined. In this article, we’ll explore the paradox using a kidney stone treatment example, demonstrate why it’s misleading, and outline how you can avoid being fooled in your own analyses.
1. Understanding Simpson’s Paradox in Plain Language
1.1 What Is Simpson’s Paradox?
Simpson’s Paradox is when a trend that appears within different groups of data reverses or disappears when those groups are combined. In other words:
Subgroup analysis: You see a certain trend in each subgroup (e.g., higher success rate for Treatment A).
Combined data: That same trend can get flipped or vanish entirely when you lump all the data together.
It’s called a “paradox” because the summary of all data can tell a contradictory story compared to the individual pieces.
2. A Simple Numerical Example
Let’s illustrate the paradox with a real-world scenario involving two different treatments for kidney stones: Treatment A and Treatment B. Researchers tracked patients with small and large kidney stones. Here’s how many patients were treated successfully under each condition:
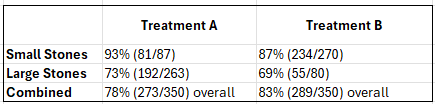
2.1 Subgroup Analysis
Small stones: Treatment A has a 93% success rate, which is higher than Treatment B’s 87%.
Large stones: Treatment A still does better, 73% vs. 69% for Treatment B.
Within each subgroup (small and large stones), Treatment A appears superior to Treatment B.
2.2 Combined Data
However, when both types of stones are combined:
Treatment A: 78% success overall
Treatment B: 83% success overall
Despite Treatment A looking better within each subgroup, Treatment B has the higher overall success rate. This is a classic demonstration of Simpson’s Paradox: the aggregated data contradicts the subgroup-level trend.
3. Why Does Simpson’s Paradox Occur?
Simpson’s Paradox usually arises due to a lurking variable or confounding factor, something that influences both the outcomes you’re observing (e.g., treatment success, acceptance rates) and how the data is grouped. When you pool data together without accounting for these hidden differences, you can end up with a distorted view of reality.
Common confounders include:
Changing Sample Sizes (one group being disproportionately large or small).
Time (e.g., seasonal spikes in customer behavior).
Demographics (e.g., age, gender, location).
Baseline Differences (e.g., departments with inherently different acceptance thresholds).
4. Why It Matters for Data Analysts
Recognizing Simpson’s Paradox is crucial because:
You risk drawing incorrect conclusions if you only look at aggregated data.
Business or policy decisions based on flawed interpretations can lead to misguided strategies.
Knowing how confounders and subgroups interact helps you paint a fuller, more accurate picture for stakeholders.
5. How to Avoid Being Misled
5.1 Segment and Visualize
Always drill down into subgroups, by time period, demographics, product type, or any other critical factor. Use simple charts or tables to spot differences. If the group-level trends and the overall trend conflict, investigate why.
5.2 Apply Statistical Adjustments
Stratification: Analyze each subgroup separately before combining.
Regression Models: Use control variables to factor out influences of potential confounders (e.g., age, location).
5.3 Seek Domain Expertise
Consult with people who understand the real-world context. They can identify hidden factors or explain complex interactions that might not be obvious from the data alone.
6. Pulling It All Together
Simpson’s Paradox isn’t just an academic curiosity, it’s a practical reminder that data can lie if you don’t investigate what’s lurking beneath the surface. By segmenting your data, accounting for confounders, and communicating results clearly, you can reduce the risk of presenting and incomplete picture.
The key lesson: Don’t take aggregate findings at face value. Always ask yourself, “Is this trend still true across different subgroups?” If the answer is no, you might be looking at Simpson’s Paradox. And by staying vigilant, you’ll be able to tell a more accurate, trustworthy story with your data.
What real-world scenario do you think best illustrates Simpson’s Paradox?