


How Walmart Automated 400+ Forecasts and Cut Runtime by Half
Their Autotuning Framework slashed errors, halved processing time, and scaled across hundreds of time series without manual tuning.

Fellow Data Tinkerers!
Today we will look at how Walmart autotuned its time series forecasting
But before that, I wanted to share an example of what you could unlock if you share Data Tinkerer with just 2 other people.
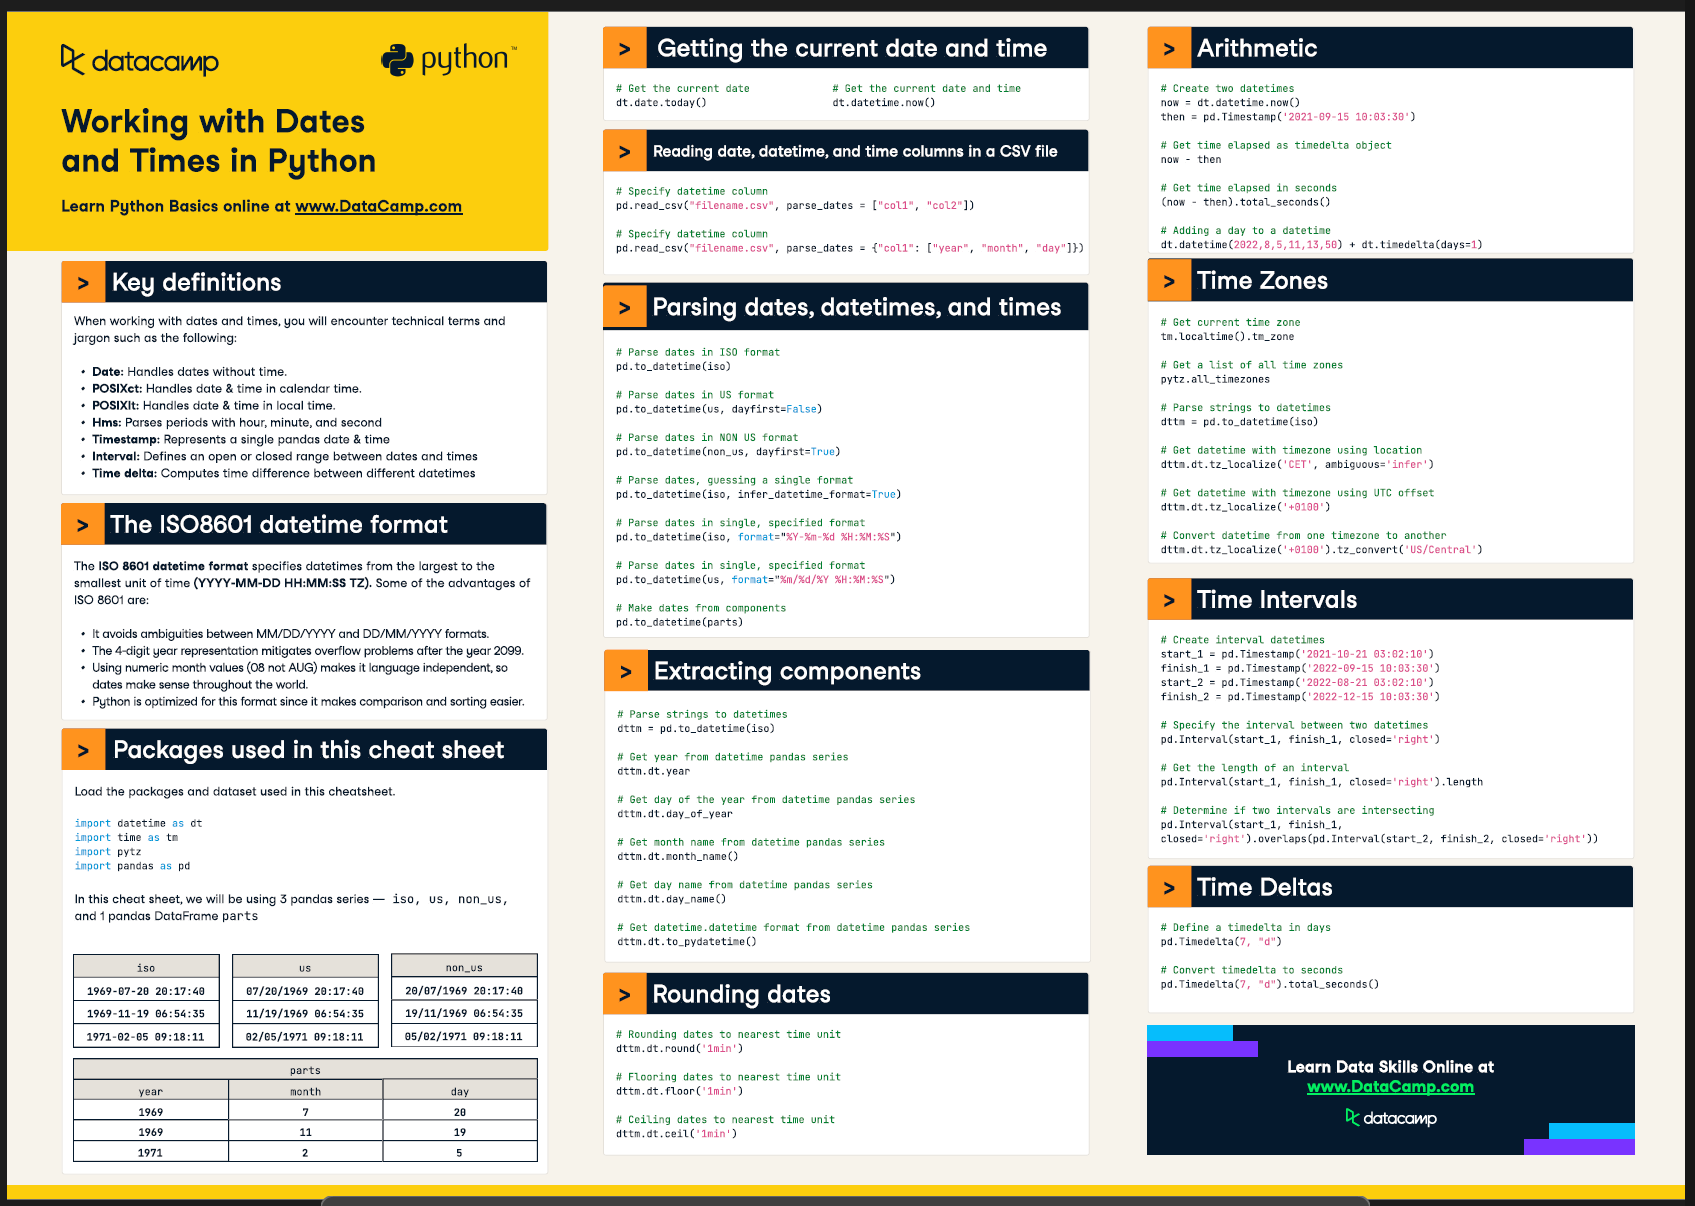
There are 100+ more cheat sheets covering everything from Python, R, SQL, Spark to Power BI, Tableau, Git and many more. So if you know other people who like staying up to date on all things data, please share Data Tinkerer with them!
Now, with that out of the way, let’s get to Walmart’s autotuning framework!
TL;DR
Situation
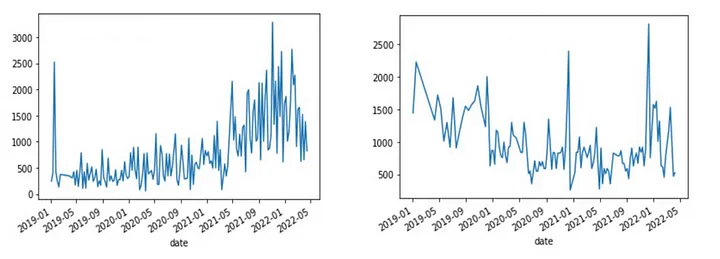
Walmart’s supply chain runs on forecasts - everything from pallets to labor hours. But when you're juggling thousands of time series with wildly different patterns (seasonality, promotions, weather, site openings...), a one-size-fits-all model just doesn’t cut it.
Task
Build a scalable, automated forecasting system that can handle constant change. It needed to be accurate, fast, and low-maintenance because tuning thousands of models manually was not sustainable
Action
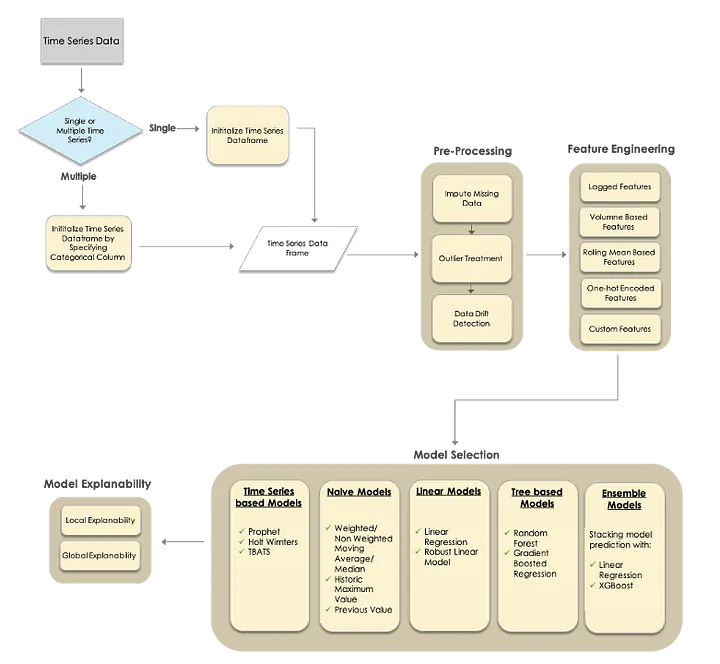
The team rolled out an Autotuning Forecast Framework that:
Cleans and preps time series data (soring out missing values, outliers, drift and others).
Engineers features at scale such as lags, rolling stats, volume trends, categorical encodings.
Runs multiple models per series (Prophet, Holt-Winters, RF, GBR...) and auto-selects the best one based on recent performance, not historical assumptions.
Uses Dask to parallelize the whole thing from preprocessing to prediction.
Adds model explainability with SHAP, trend breakdowns, and regressor insights so people actually trust the outputs.
Result
1- Accuracy up: Significant MAPE reduction across 400+ weekly series.
2- Runtime down: 50% faster thanks to multiprocessing.
3- Deployment faster: Models go from dev to prod with far less manual work.
Use Cases
Supply chain forecasting, dynamic planning, forecast explainability
Tech Stack/Framework
PELT algorithm, Time Series models, Tree Based models, Ensemble models, Dask
Explained Further
Why Walmart needed to rethink forecasting
Forecasting at Walmart isn’t just a technical exercise, it’s a daily operational necessity. When you’re managing thousands of time series across a vast, ever-changing supply chain, accuracy isn’t a nice-to-have. It’s core to avoiding expensive missteps like overstaffing a warehouse or understocking stores before a big event. Walmart’s data team needed something flexible, automated, and scalable. Enter: the Autotuning Forecast Framework.
Why automatic model selection?
Traditional time series modeling is often built on historic back-testing. You pick a model that worked well in the past, tune it up, and hope for the best. But in a live retail environment where trends shift with seasons, sales, or even surprise pandemics, those past performance metrics can become useless.
That’s why Walmart moved to a continuous validation model. Instead of trusting history, the framework keeps checking which model is currently performing best, based on the most recent window. It picks winners not from intuition, but from recent validation stats and keeping up with drift, chaos, and seasonality without constant babysitting.
How the framework works end-to-end
Step 1: Clean the data first
Before anything else, the time series data has to be cleaned and stabilized:
Auto frequency detection guesses the series’ time interval if not explicitly set as long as there are at least 8 data points.
Missing values are imputed using rolling stats or day-of-week averages (for daily series).
Outliers are flagged using IQR after decomposing the series into trend, seasonality and residuals. They are then imputed just like missing data.
Data drift detection is handled using the PELT (Pruned Exact Linear Time) algorithm, with changepoints filtered using CROPS (Changepoints for a Range of Penalties) to avoid noise and tune the penalty threshold.
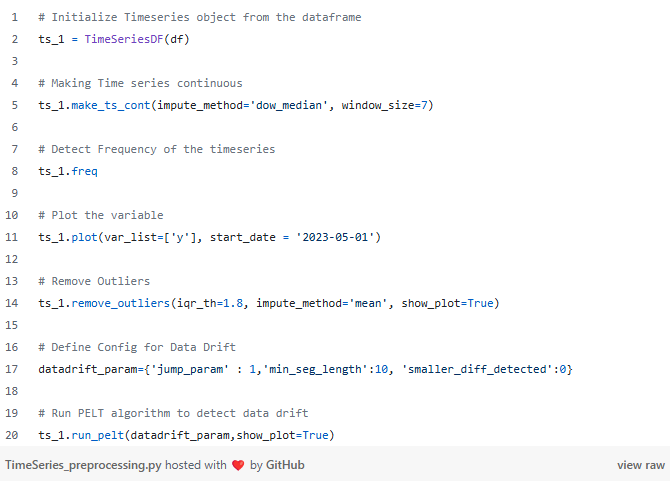
All of this keeps the input data from tripping up models before they even get a chance to run.
Step 2: Add smarter features
Walmart’s framework supports a solid library of feature types:
Lag features for both dependent and independent variables.
Volume-based features for weekly time series that track year-over-year behavior in the same week (and its neighbors).
Rolling means calculated with respect to the forecast horizon to avoid leakage.
One-hot encoding of categorical regressors for tree models like Random Forest and Gradient Boosting.
Custom features are also supported for edge-case logic specific to a series or domain.
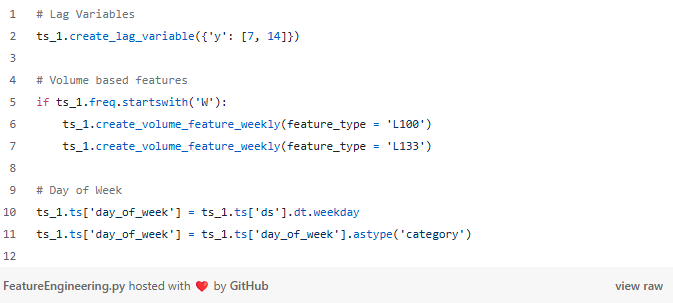
Each of these gives the models more context like what happened in the same week last year, or how a holiday shifts demand without hardcoding assumptions.
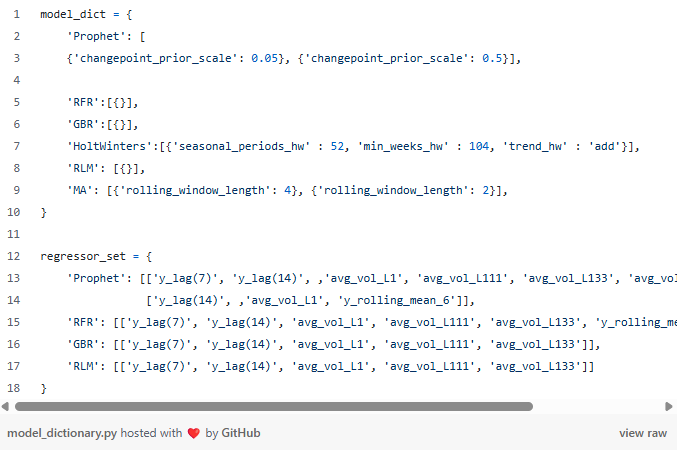
Step 3: Let the models compete
Here’s where the “autotuning” part earns its name.
The user defines a dictionary of models, hyperparameters, and regressor sets. The framework:
Runs each model across validation windows,
Tests each parameter and feature set combo,
Scores them using metrics like MAPE, RMSE, MAD,
Picks the best performer based on recent validation results, not outdated backtests.
Supported models include:
Time Series: Prophet, Holt-Winters, TBATS
Naïve: Moving Average, Historical Max, Previous Value
Linear: Linear, Robust Linear
Tree-based: Random Forest, Gradient Boosting
Ensembles: Stacked predictions using Linear or XGBoost
Models like Prophet also support automatic seasonality detection via FFT, adding depth without needing hardcoded calendars.
Step 4: Forecast, validate, repeat
The process looks like this:
Start at a refresh week (T₀), forecast ahead to T₁–Tₙ
Backtest across a user-defined validation window
Pick the combo that wins most consistently
Re-train the winning model using the most recent data
Forecast forward
It’s designed to work for any frequency whether daily, weekly, monthly, even yearly.
Step 5: Open the “black box”
Forecasting isn’t helpful if you can’t explain it. The framework supports:
Global feature importances (via coefficients or feature importances from tree models)
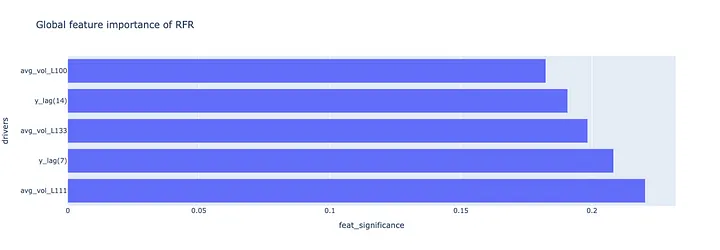
Local feature explanations (using SHAP values for individual predictions)
Decomposed components like trend, seasonality, and holiday effects for models like Prophet
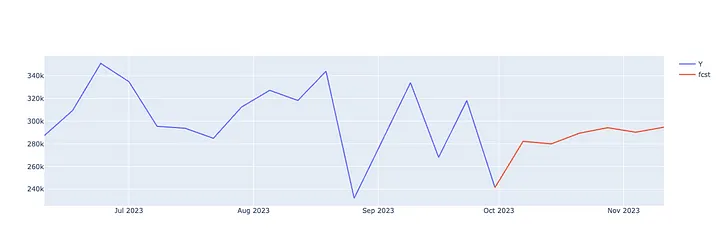
You can also plot actuals vs. forecasts to visually spot drifts, anomalies, or missed patterns. This keeps stakeholders in the loop and helps troubleshoot unexpected outputs.
Results
More accurate forecasts: The framework beat out a baseline Prophet model across 400 weekly time series, each representing a different node in the supply chain. Across 5 refreshes, MAPE consistently dropped, a big win considering how diverse and unpredictable the series were.
Faster runtime: Running all these models and tests takes horsepower. So they used Dask, a parallel computing library, to split the work across 15 cores. That cut runtime by about 50% even with complex pre-processing and feature engineering happening in parallel.
Quicker to production: Most forecasting projects get bogged down in prep like EDA, feature engineering, model tuning. But with this modular, repeatable system, Walmart got faster at shipping models to prod. Custom logic can be added when needed (like handling drift by inserting level shifts) but the core workflow stays stable and reusable.
Lessons Learned
No single model fits all: Even models like Prophet fall short across diverse series. A flexible, multi-model approach was essential.
Recent > historical: Continuous validation outperformed old-school backtesting by catching drift early and adjusting on the fly.
Clean data is non-negotiable: Outliers, gaps, and drift will wreck your accuracy if not handled upfront. Preprocessing saved time and sanity.
Classics still work: No deep learning here, just tree models, linear models, and clever features. Accuracy improved without added complexity.
Explainability matters: SHAP values and trend components helped stakeholders understand and trust the forecasts which meant they actually used them.
The Full Scoop
To learn more about the implementation, check Walmart’s Blog post on this topic
If you liked this article but you haven’t subscribed yet, subscribe below to:
1- not miss next articles like this
2- have access to a list of curated 120+ data science/data engineering technical articles from major companies (Nextflix, Airbnb, Apple, Microsoft and etc) for free!