


P-Hacking: How to Make Anything “True” with Enough Data Tricks
Just keep testing until something works. What could possibly go wrong?

Fellow Data Tinkerers!
Thank you to those who provided feedback this week and to the 2 people who shared the publication with others. I really appreciate it ❤️
I wanted to share an example of what you could unlock if you share Data Tinkerer with just 3 other people.
There are 100+ more cheat sheets covering everything from Python, R, SQL, Spark to Power BI, Tableau, Git and many more. So if you know other people who like staying up to date on all things data, please share Data Tinkerer with them!
Now, without further ado, let’s get into a data analysis issue you want to avoid!
You’ve launched a new A/B test: a green “Buy Now” button vs. the classic blue.
First check: p = 0.08
Second check: p = 0.06
Third check after lunch: p = 0.049
It’s significant, baby!
You screenshot it. You Slack it. You present it. But deep down, you know: you didn’t find truth, you just refreshed the data until the universe gave up.
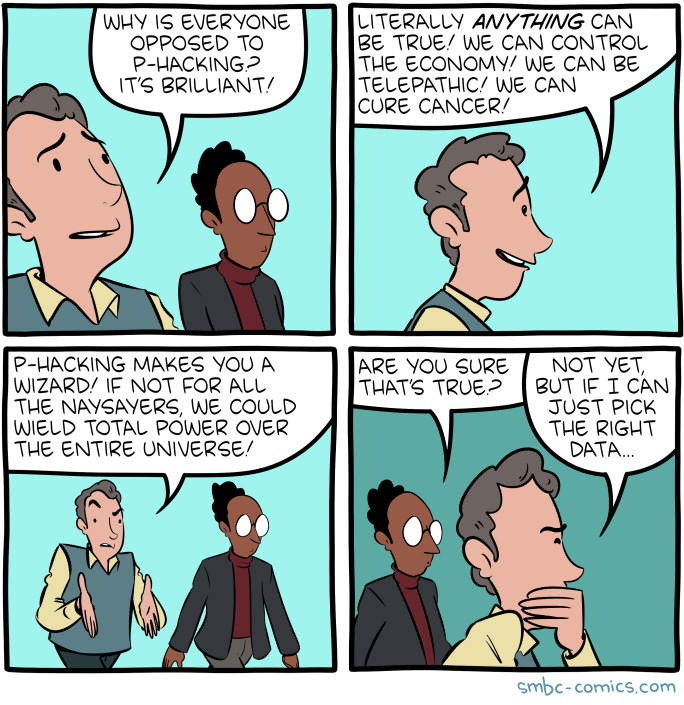
Welcome to the world of p-hacking, where stats are optional and significance is flexible
So what is P-Hacking and why should you care?
P-hacking (a.k.a. “p-value hacking”) happens when you run enough tests, tweak enough variables, or slice your data enough ways until something finally hits p < 0.05—the magical threshold for “significance.”
It can look like:
Peeking at results every hour until they’re good enough to report
Filtering “outliers” that ruin your narrative
Changing your KPI mid-test because the original one was stubborn
Running 15 variations and only presenting the one that worked
On the surface, this seems smart. You're “exploring the data.”
But what you're really doing is rolling the dice until you get lucky and calling that luck an “insight.”
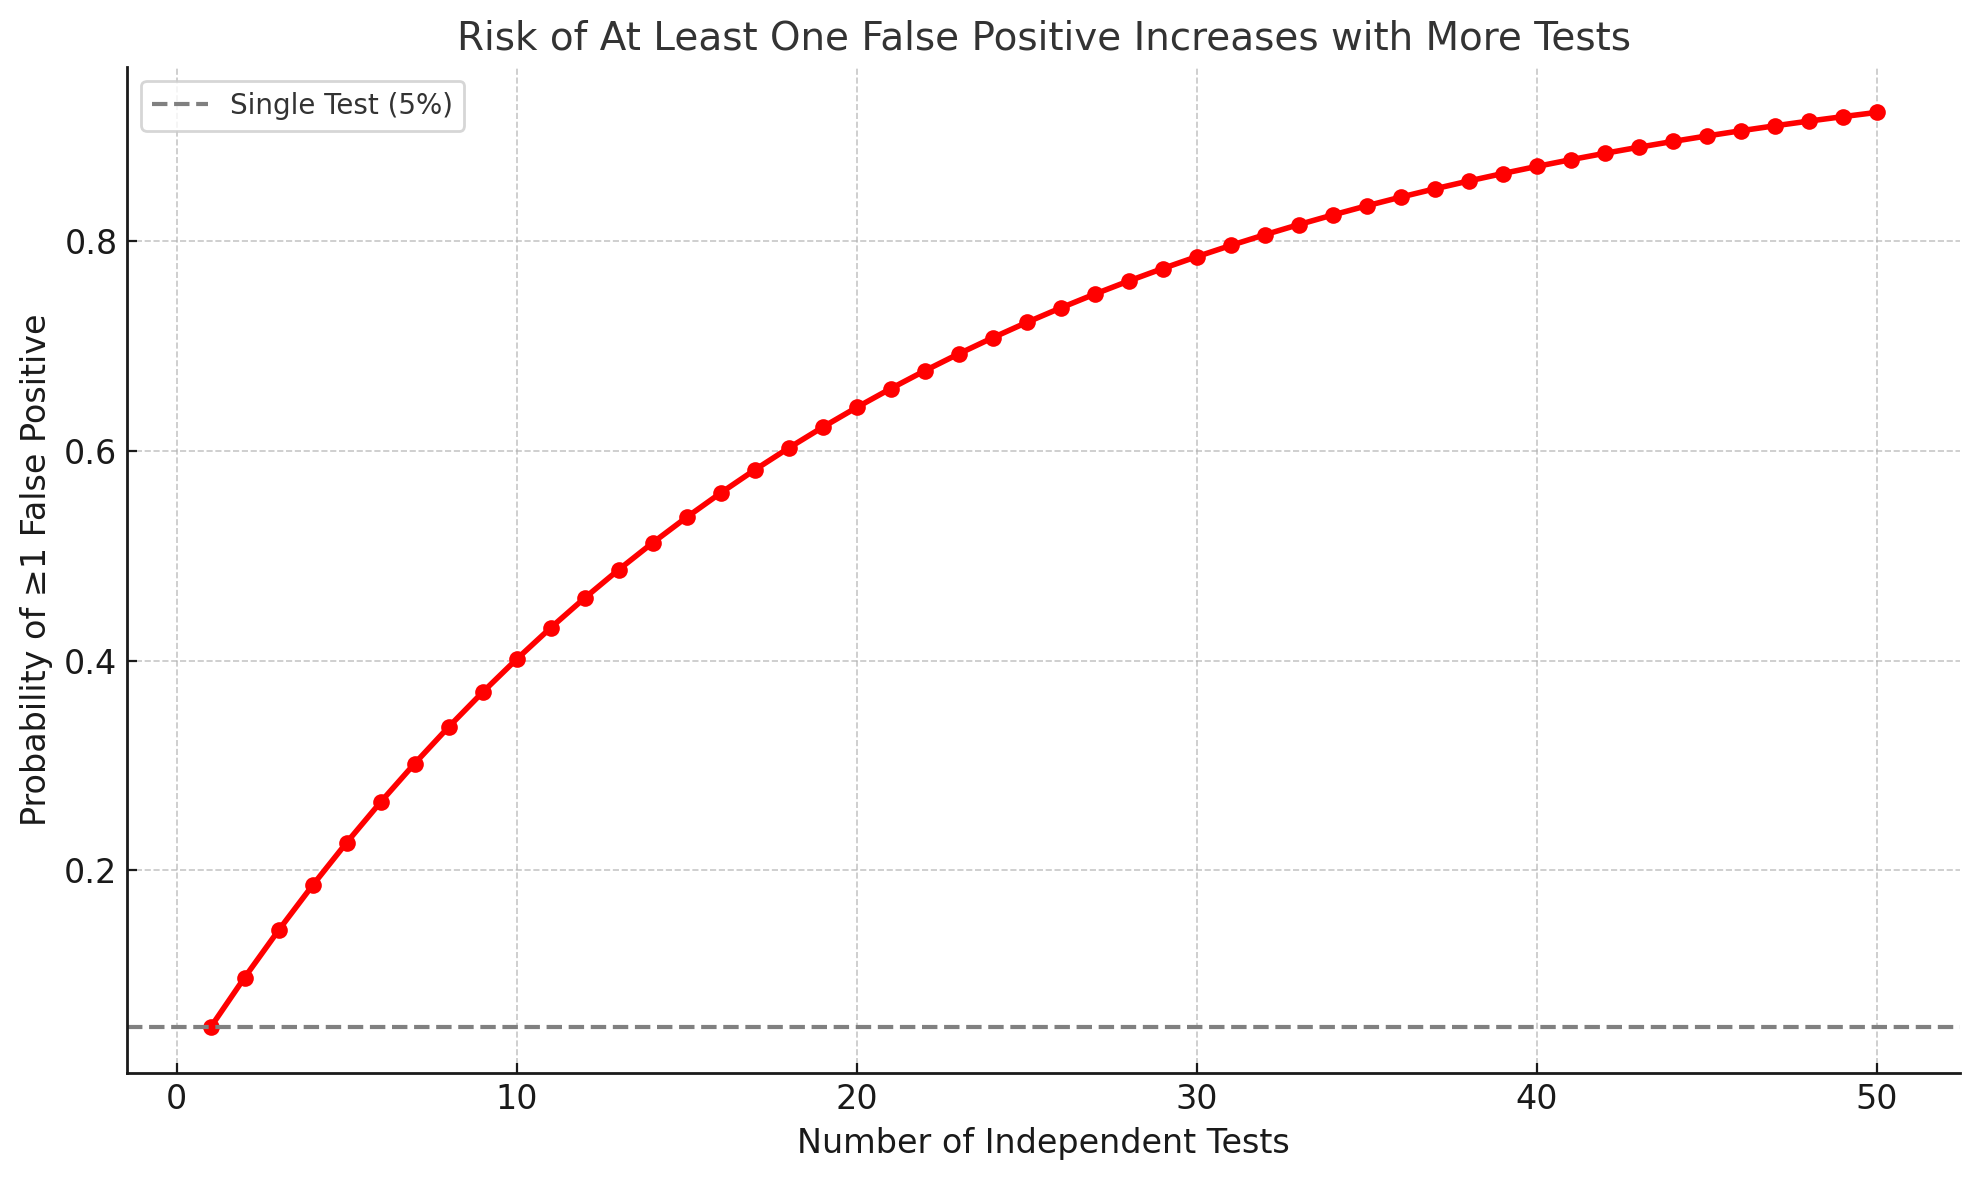
Let’s say you run a bunch of random experiments.
After 5 tests, there’s a 23% chance you’ll get a false positive.
After 20, that chance climbs to 64%.
After 50, it's nearly 93%.
You're not analyzing data anymore. You're doing statistical Tinder, just swiping until something says yes.
And it happens everywhere.
In marketing, where someone shouts “This ad increased clicks by 12%!” (ignoring the other 9 that flopped).
In product teams, where A/B tests quietly die if they’re boring.
In academic research, where publish or perish leads to results that don’t replicate.
The worst part? P-hacking doesn’t just create false wins, it creates real decisions based on fake results. You launch features, spend budget, or change strategy… all because your dashboard found patterns in noise.
How to avoid P-Hacking then?
Pre-register what you’re testing: Decide what you’re testing before you look at the data. (And no, vibes are not a test plan.)
Adjust for multiple comparisons: Use Bonferroni correction or False discovery rate if you're testing more than one thing
Report all your results: Even the boring ones Because boring = honest.
Focus on effect size not just p-value: A tiny bump that’s technically significant is still… a tiny bump.
Be the annoying skeptic: “Did I correct for x?”, “Am I sure that’s not noise?”
Final thoughts: Stop treating p < 0.05 like It’s a slot machine
P-hacking feels like clever analysis but it’s actually a trap. One that makes noise look like signal and erodes trust in your work.
So next time you’re tempted to peek early, filter creatively, or chase that p-value like it owes you money… pause.
🚫 Don’t be the analyst who finds something "interesting" in every dataset.
✅ Be the one whose results actually mean something.
And if nothing’s significant this time?
That’s not failure. That’s integrity.
(Unless your job depends on monthly “insights”. If that’s the case then good luck and may the p-values ever be in your favor.)